Finova Analytics Dashboard: A Modern Fintech UI Kit
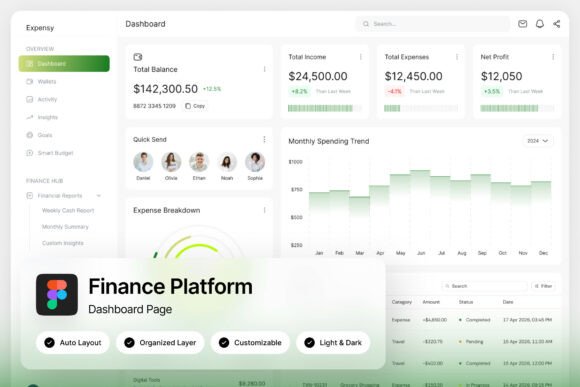
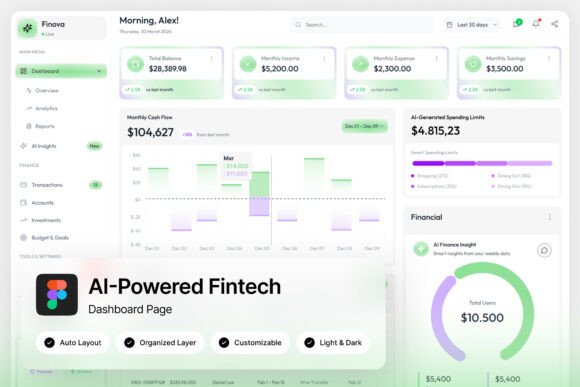
Imagine a dashboard where your financial data feels clear, organized, and even calming to look at. That's the promise of the Finova Analytics Dashboard, a fresh, light-themed UI kit designed for the modern era of personal finance and digital banking.
For designers and developers in the fintech space, finding a user interface that balances sophisticated data visualization with an approachable aesthetic can be a challenge. Finova presents a compelling solution. Built around a clean green-and-white palette, it transforms complex information—like wallet balances, spending analytics, and transaction histories—into an intuitive, consumer-friendly experience. The inclusion of circular progress indicators and well-organized transaction lists makes monitoring finances feel effortless, not overwhelming.
Why This Dashboard Kit Stands Out
Beyond its appealing look, the practical value of this design asset is significant. The package includes two high-quality admin dashboard screens at a crisp 1440×1024 px resolution. Every element is fully customizable, with layers that are well-organized, named, and grouped, which drastically speeds up the editing process. For teams working in Figma, the included .fig file is a major plus, allowing for seamless integration into existing workflows. The design is also responsive and mobile-first, a critical consideration for any SaaS product or neobank application aiming for a broad audience.
Creative Applications and Design Flexibility
The true strength of a resource like the Finova Analytics Dashboard lies in its versatility. While its primary function is for fintech and banking interfaces, its modern typography and clean layout offer a foundation for numerous projects. Consider how its visual language could elevate:
- Brand Identity Systems: The dashboard's style guide can inform a broader brand identity, ensuring consistency across a website, mobile app, and marketing materials.
- Editorial and Web Design: The clear hierarchy and readable fonts are ideal for financial blogs, news sites, or magazine layouts dealing with tech and business topics.
- Presentation and Pitch Decks: Use the dashboard mockups and its cohesive design system to create professional, data-driven presentations for investors or stakeholders.
- Marketing and Social Media Graphics: The clean aesthetic is perfect for creating sleek social media posts, infographics, or banner ads that need to convey trust and innovation.
Tips for Choosing and Using a UI Kit
When selecting a design asset like this, it's wise to look beyond the first impression. First, assess its readability. Does the typeface hierarchy hold up when displaying dense data? Next, consider the mood. Does the light, green-themed palette align with your project's goal of feeling fresh and trustworthy? A great practice is to test font pairings early. While the kit includes free Google Fonts, see how they integrate with your existing brand fonts. Always review the available styles and ensure the license covers your intended use, whether for a client project or a commercial product.
Ultimately, a well-crafted dashboard UI does more than just display numbers. It builds user confidence, enhances engagement through clarity, and reinforces a brand's commitment to a superior user experience. Choosing a thoughtfully designed system like this can be the first step toward creating digital products that are not only functional but also genuinely pleasant to use.