Investment Analytics Dashboard: A Sleek UI for Modern Finance
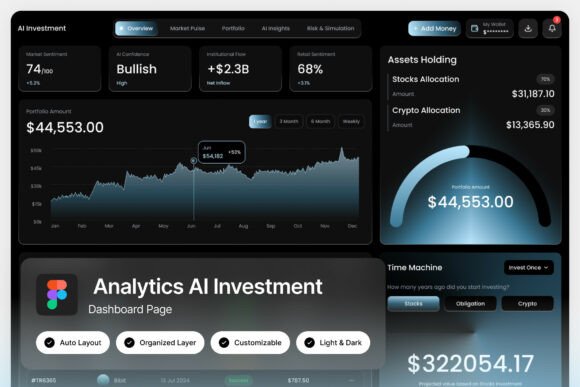
In the fast-paced world of financial technology, clarity and precision are paramount. The Investment Analytics Dashboard UI kit offers a sophisticated, dark-themed interface designed specifically for investment platforms, wealth management applications, and fintech designers seeking a polished, professional look. Its deep blue-black and teal color palette provides a calm, focused environment where complex data becomes intuitive and actionable.
This design asset is built around key financial visualization components. Users will find portfolio performance gauges, detailed asset allocation charts, and clear profit tracking cards that present vital information at a glance. Complementing these are intelligent insight panels, which help translate raw data into meaningful trends and opportunities. The result is a minimal yet data-rich interface that supports confident decision-making without visual clutter.
Design Features and Flexibility
For designers and developers, this dashboard template provides a strong foundation. The package includes two high-quality admin dashboard screens at a crisp 1440×1024 pixel resolution. Every element is built with a pixel-perfect layout, ensuring that your final product looks sharp across devices. The layers are well-organized, named, and grouped, making customization in design tools like Figma straightforward and efficient.
The inclusion of free Google Fonts and a dual light and dark mode interface adds significant versatility. Whether you are designing a mobile wealth management app or a comprehensive web-based trading platform, you can adapt the aesthetic to match your brand identity. This flexibility makes it a valuable component in a broader design system, helping to maintain visual consistency across all user touchpoints.
Practical Applications for Your Projects
While its primary purpose is financial software, the principles of its clean typography and structured layout are widely applicable. The design’s emphasis on clear data hierarchy and modern typography can inspire projects beyond fintech. Consider how its approach to presenting information could influence:
- Editorial and Report Design: Annual reports, market analysis PDFs, or data-driven articles benefit from a similar clean, authoritative aesthetic.
- Presentation and Pitch Deck Design: Use the color scheme and gauge-inspired charts to create compelling investor presentations or business summaries.
- Brand Identity for Tech Startups: The sophisticated, modern feel can inform logo design, website headers, and social media graphics for any data-centric or professional service brand.
The key is to draw inspiration from its balance of sophistication and functionality. The dark mode interface, in particular, can reduce eye strain for users who spend long hours analyzing data, a thoughtful consideration for any user-focused digital product.
Tips for Integrating and Customizing
When incorporating this design into your workflow, start by examining the underlying structure. The well-organized Figma file allows you to easily isolate components like the asset allocation charts or insight panels for use in other contexts. Test different font pairings with the included Google Fonts to see how a complementary sans-serif for body text or a bold display font for headings can alter the mood while maintaining professionalism.
Always ensure that any design assets, especially those used for commercial projects, have a license that fits your intended use. The provided help guide and font links in the download package are there to assist with a smooth setup. By taking the time to customize these elements thoughtfully, you can create a unique and cohesive experience that feels tailored to your specific application.
Choosing the right design assets is about more than just aesthetics; it’s about finding tools that enhance usability and communicate trust. A well-crafted interface like this Investment Analytics Dashboard provides a robust framework that can elevate your project’s visual presentation, making complex information accessible and your product feel inherently more reliable and professional.