Syncra Report Dashboard: Streamline Your Team's Productivity
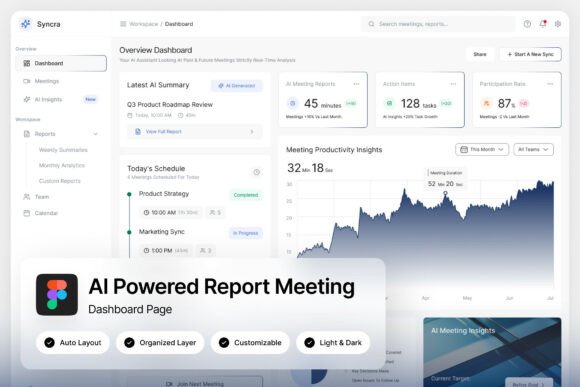
Imagine a workspace where every meeting summary, action item, and productivity metric is instantly accessible in one sleek, intuitive interface. That’s the promise of the Syncra Report Dashboard, an AI-powered UI kit designed to transform how modern teams collaborate and track progress. Its dark-themed aesthetic, accented with a cool blue gradient, feels both professional and visually engaging, making it a standout asset for designers and product builders.
This isn't just another generic admin template. Syncra is built with a deep understanding of workflow efficiency. The two high-quality screen layouts (1440×1024 px) include dedicated panels for meeting summaries, agenda trackers, and action items, alongside clean productivity charts. Every element is pixel-perfect, with well-organized and named layers in Figma, ensuring you can customize it to match your brand identity without friction. The inclusion of both light and dark mode interfaces adds remarkable flexibility for different user preferences and contexts.
Where This Dashboard Design Shines
The practical applications for a tool like Syncra are vast, particularly for anyone building or designing digital products. It’s an ideal starting point for:
- Productivity SaaS platforms: Quickly prototype or build out the core reporting and collaboration features of your application.
- Remote team tools: Design interfaces that help distributed teams stay aligned with clear agendas and tracked action items.
- Enterprise collaboration software: Create a polished, professional UI for internal tools that manage projects, meetings, and performance data.
For designers, Syncra serves as a powerful component library. You can pull its charts, cards, and navigation elements to inspire or accelerate other web design projects, ensuring a consistent and modern typography style across your work. The free Google Fonts included make it easy to maintain visual harmony.
Choosing the Right Design Assets
When selecting a UI kit or dashboard template like this, consider how it aligns with your project’s core needs. Think about the specific workflows it needs to support—does it clearly visualize data? Is the navigation intuitive? Syncra’s strength lies in its focused approach to meeting and report management, so it’s perfect if that’s your primary use case.
Always test the asset in context. Import the Figma file and see how the components feel when populated with your own content. Check the readability of the text overlays on charts and the usability of the agenda tracker. A well-designed system like this should feel like a natural extension of your team’s process, not a hindrance.
Finally, remember that a great design asset is about more than just aesthetics; it’s about function. The right template can dramatically improve your team’s visual consistency, streamline the design-to-development handoff, and elevate the professional presentation of your product. Syncra Report Dashboard offers a thoughtful blend of style and substance, providing a solid foundation to build efficient, beautiful tools that people genuinely enjoy using.